
The Friday Five – NursesNOW Infographics Roundup
Every so often we compile some statistics, facts and figures to create infographics that report our findings. This week’s Friday Five highlights some of our…
Read More
Every so often we compile some statistics, facts and figures to create infographics that report our findings. This week’s Friday Five highlights some of our…
Read More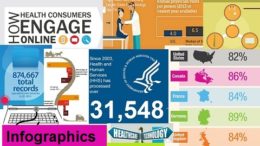
Infographics are great way to display statistical data that shows comparisons or charts that come from research and reports. Check out these we want to share.
Using a picture and visual graphics to represent data and information is called an infographic. It is a great way to display statistical data that shows comparisons or charts that come from research and reports. Here are some we thought were interesting enough to share.
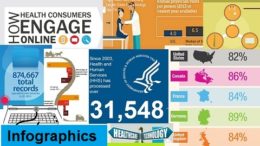
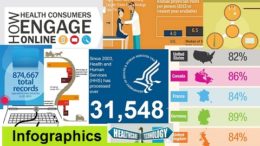
Infographics are great way to display statistical data that shows comparisons or charts that come from research and reports. In these infographics see the impact data breaches are having on the US healthcare industry, how privacy and security are key pillars to effectively serving patients and avoiding costly data breaches, and what the trends and challenges were in 2015.
Infographics are great way to display statistical data that shows comparisons or charts that come from research and reports. In these infographics see what’s important to physicians when in comes to teleheath, how e-prescribing can reduce errors, fraud and abuse, and see the history of electronic health records and how they may improve your health and health care in the future.
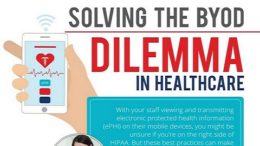
As an IT professional in the healthcare industry, you know the importance — indeed, the legal necessity — of ensuring that your organization’s patient information remains protected at all times. That’s why we’ve consolidated 10 best practices for you, from healthcare IT thought leaders, in a new eFax Corporate® infographic
In these Connected Health infographics, see the top 10 trends for 2015, how Americans manage health & communication with providers, what a virtual coach is, and the benefits and challanges of a connected health environment. See other infographics we have featured.
Using a picture and visual graphics to represent data and information is called an infographic. Here are selected hospital challenges Infographics.
Using a picture and visual graphics to represent data and information is called an infographic. Here are selected ICD-10 Infographics.