
Healthcare Technology, Innovations, and Storage Infographics
Using a picture and visual graphics to represent data and information is called an infographic. Here are selected healthcare technology, innovations, and storage Infographics.
Read More
Using a picture and visual graphics to represent data and information is called an infographic. Here are selected healthcare technology, innovations, and storage Infographics.
Read More
In these ICD-10 infographics, see the results of an ICD-10 readiness survey, what impact ICD-10 will have, how famous Shakespearean characters would be diagnosed with ICD-10 codes & how we can get on track for ICD-10.
In these Digital Health infographics, see what’s on the horizon for healthcare delivery in 2015, how willing Americans are to leverage health apps & wearable devices to improve their health, and how medical devices are being used in hospitals. See other infographics we have featured.
In these Patient Engagement infographics, see how patients are engaging through social media, how individual patients value digital services, how to improve patient engagement, & how healthcare has gone social.

Deloitte Center for Health Solutions has released its latest findings in its annual check up on health IT adoption, The report examines physicians’ current views and use of EHRs, mobile health technologies and meaningful use.
Infographics are a great way to display statistical data that shows comparisons or charts that come from research and reports. In these Interoperability infographics, see how meaningful use stage 2 and connected hospitals are shaping interoperability.
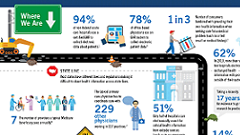
ONC created a roadmap infographic showing where we are now and where we are going from the Shared Nationwide Interoperability Roadmap. See what is in store for the next decade.

Using a picture and visual graphics to represent data and information is called an infographic. It is a great way to display statistical data that shows comparisons or charts that come from research and reports.
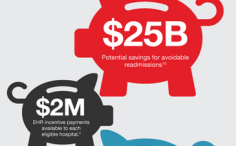
Using a picture and visual graphics to represent data and information is called an infographic. It is a great way to display statistical data that shows comparisons or charts that come from research and reports. In these Practice Management infographics, see what the real costs are of getting paid, what Million Hearts is, and where you stand with EHR’s.