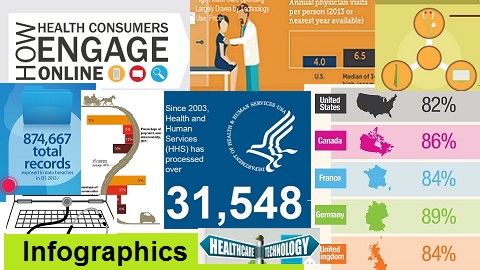
Revenue Cycle Issues Infographics
Using a picture and visual graphics to represent data and information is called an infographic. It is a great way to display statistical data that shows comparisons or charts that come from research and reports. In these infographics, see the transformation of value-base care, the top billing mistakes in women’s health, the true costs of transitioning to ICD-10, & RAC audits.
Read More