NextGen Healthcare

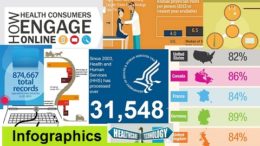
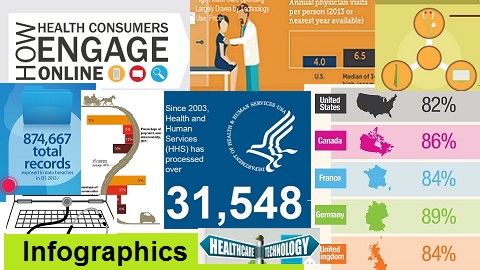
Health Care Financing Infographics

Using a picture and visual graphics to represent data and information is called an infographic. It is a great way to display statistical data that shows comparisons or charts that come from research and reports. In these infographics, see a revealing look at RCM, 8 ways to raise your margins, the top revenue cycle KPI’s, & the global health care sector outlook for 2016.

Read More

Revenue Cycle Issues Infographics

Using a picture and visual graphics to represent data and information is called an infographic. It is a great way to display statistical data that shows comparisons or charts that come from research and reports. In these infographics, see the transformation of value-base care, the top billing mistakes in women’s health, the true costs of transitioning to ICD-10, & RAC audits.


HIE Rundown 7-24-15

This week’s rundown includes: Quality Health Network & eHealth Technologies joining forces, highlights from the Digital Health Summer Summit, Orion Health named a leader in IDC HIE, & NextGen Healthcare successfully connects to Mass HIway.


ICD-10 Infographics

In these ICD-10 infographics, see the results of an ICD-10 readiness survey, what impact ICD-10 will have, how famous Shakespearean characters would be diagnosed with ICD-10 codes & how we can get on track for ICD-10.


HIE Rundown 11-10-14

Health Information Exchange (HIE) is happening every minute of every day. Your personal health information is moving and being viewed to improve the quality of…


HIE Rundown – 8/26/14

Health Information Exchange News & Announcements Health Information Exchange (HIE) is happening every minute of every day. Your personal health information is moving and being…