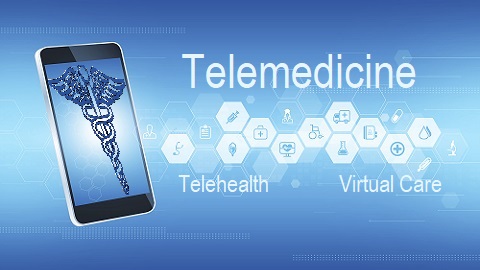
American Hospital Association


Revenue Cycle Issues Infographics

Using a picture and visual graphics to represent data and information is called an infographic. It is a great way to display statistical data that shows comparisons or charts that come from research and reports. In these infographics, see the transformation of value-base care, the top billing mistakes in women’s health, the true costs of transitioning to ICD-10, & RAC audits.


2015 Most Wired Survey and Benchmarking Study Now Open

The 2015 Most Wired Survey is now open, the American Hospital Association’s Health Forum and the College of Healthcare Information Management Executives (CHIME) announced. Published annually by Hospitals & Health Networks magazine, Health Care’s Most Wired Survey and Benchmarking Study is a leading industry barometer that measures information technology (IT) use and adoption among hospitals nationwide.