
 By Rod Baird
Twitter: @rod99309
The ICD-10 Doom’s Day passed; the sky did not fall. Now it’s time to get back to the mundane world of managing LTC Medical Practices. Each year, since 2012, CMS sends large medical groups the annual Quality Score Card for the prior year. Starting this year, every group that billed Medicare Part B during 2014 has a report available. If your group hasn’t downloaded its report, CMS provides links and a handy tutorial in their September 17th Webinar. Providers who belonged to any type of ACO or Shared Savings Program during 2014 need to access this data through that organization.
We published statistical analyses of QRUR Data for 2012 and 2013 in previous blogs and articles in Caring for the Ages.
To date, we’ve seen copies of QRUR reports from 6 different LTPAC Medical Groups, and discussed summary results with other providers. What’s striking is the uniformity of scores – a statistical improbability.
Quality Composite Scores
- Reporting via a registry using a Measures Group strategy works. Each of the groups we reviewed submitted a Measures Group report for >50% of the Clinicians under their TIN (taxpayer Identification Number).
- Every group in this small sample has a positive Quality Score for Value Based Purchasing. Those scores ranged between +0.2 and +0.6 Standard Deviations (for a geeky exposition on the statistics behind PQRS scores read this blog post)
- Each group’s Quality performance was dragged down by one or more claims-based CMS Calculated Outcome Measures for hospitalization/rehospitalization rates.
- CMS-1 (Acute Conditions Composite) measure was the universal problem. This measures annual hospitalization rates for Bacterial Pneumonia, UTI, and Dehydration. Most LTPAC Medical Groups capture new patients from their SNF admissions. By definition, all SNF Admissions have a preceding Hospital Episode of care – many for one of those Acute Conditions. This is a perfect example of Adverse Selection in action.
Cost Composite Scores
- LTPAC Medical Groups that employ Physicians should hang their heads in shame – they remain BAD DOCTORS! All of those groups scored as high cost – with scores ranging from <-1.6> to <-2.6>. Cost is an inverse measure – the lower the score, the higher the risk adjusted cost of care. This is consistent with data from 2012 and 2013.
- LTPAC Medical Groups that do not employ Physicians received a neutral (0) Cost Score. While they serve the identical patient population, CMS’s patient attribution scheme assigns patients to a PCP if one exists. Since Medicare SNF rules require an Admitting Physician to perform the initial encounter, it is unlikely that an NP only group would have attributed patients.
What does all this mean & what strategies are appropriate until MIPS starts?
These 2014 QRUR reports drive Medicare Part B Payment Adjustments for CY 2016. If your group was below a headcount of 100 (as of 7/1/2014) there is no penalty (i.e. negative adjustment) for you in 2016.
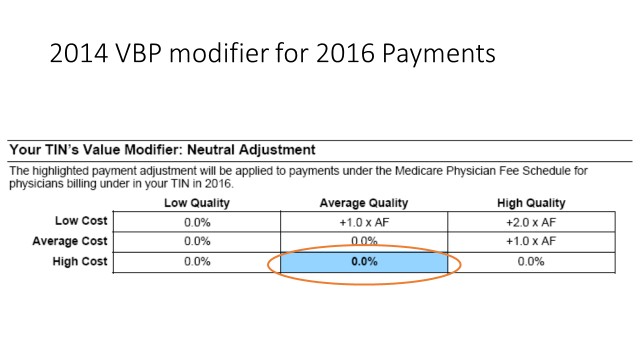 If your group satisfactorily reported PQRS, there is a quality tiering ranking: Providers shouldn’t be lulled into complacency because they avoided a penalty adjustment for poor performance in 2014. CMS is applying the stick to all groups with a physician in 2017. The payment adjustments are based on 2015 scores.
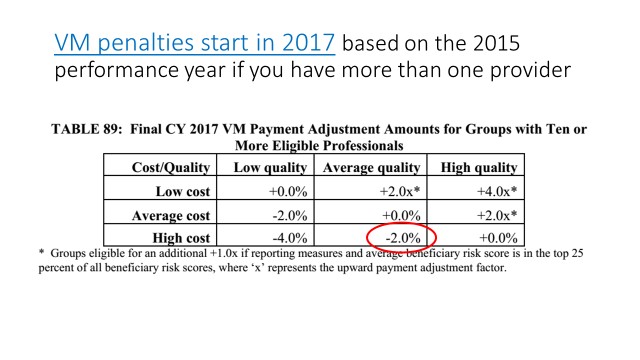 Groups that avoided penalties for 2014 performance will receive at least a <2%> adjustment in 2017 based on their 2015 performance. That’s because CMS rules now expose all groups with a physician to penalties a well as incentives.
Penalties in 2017 based on 2015 are unavoidable – the rules are already in place. If you are in LTPAC Medicine (and submit claims for at least 1 physician), you should plan on that pay cut.
What the Future Holds: Thanks to persistent work of AMDA, other Professional Associations, and their members, CMS grudgingly acknowledged that their cost adjustment methodologies for VBP might be inaccurate. The following request for suggestions was posted in the Draft 20116 Medicare Physicians Fee Schedule (PFS).
“Discussion of Stratification of cost measure benchmarks by beneficiary risk score. In response to our previously-finalized policies, stakeholders have suggested that the CMS-hierarchical condition categories (HCC) Risk Adjustment methodology used in the total per capita cost measures for the VM does not accurately capture the additional costs associated with treating the sickest beneficiaries . Some of these commenters stated that groups that work exclusively in post-acute and long-term care settings would be unable to perform well on cost measures under the current methodology.”
… “We note that high costs within the post-acute and long-term care settings present a unique opportunity for these providers to improve performance on cost and quality measures.”….
…”One option we are considering would be to stratify the cost measure benchmarks so that groups and solo practitioners are compared to other groups and individual practitioners treating beneficiaries with similar risk profiles. In this way, within a given grouping (for example, a quartile or decile), there remains an opportunity to gain efficiencies in care and lower costs, while beneficiary severity of illness and practice characteristics may be more fully recognized at a smaller, and likely less heterogeneous, attributed beneficiary level.”…
The draft regulation continued on for several paragraphs – the gist of their comments was that change was possible, but it sounded highly improbable that any adjustment would occur for CY 20116 reporting. If correct, that means that <2%> adjustment for being high cost will remain until MIPS (Merit Based Incentive Payment System) begins with 2017’s reporting.
The only near term glimmer of hope was a regulatory proposal to remove the SNF Place of Service code (POS 31) from the definition of Primary Care sites for ACO attribution. That mechanism is the same used in patient attribution under the VBP program. AMDA and its members, in comments on this proposal, urged CMS to extend that same proposed change in the Primary Care Definition for ACOs to VBP.
Let’s assume that prediction is accurate – what could it mean for the cost profile of LTPAC Groups?
- What If POS 31 is eliminated as a primary care Place of Service? – Some of the high cost patients currently attributed to LTC Physicians will drop from the patient population – that’s a good step. However, I doubt that this change, by itself, will move the typical LTC Group into the ‘Average Cost’ category. Our analysis of 2012 and 2013 QRURs showed the long term population (patients served in non-skilled settings) were still in the High Cost category.
- What if CMS does follow-through with the thought about benchmarking costs based on Patient Acuity (e.g. constructing cost profiles for each quartile or decile based on the average Risk Adjustment Factor (RAF))? If this does become the method of cost benchmarking – all physicians treating Chronic Care Patients will immediately receive fairer treatment.
- If this comes to pass, the need to document the full spectrum of patient Acuity via use of complete diagnostic descriptions of all patient problems will become a key strategy. Most LTC Groups do not do a good job of documenting Acuity – and ICD-10 will probably set-back any existing plans thanks to confusion from the transition.
Groups interested in working on their cost profile should seriously consider the benefits that will accrue from documenting all the problems their LTC patients have which contribute to Acuity. In addition to documenting all problems accurately, providers who become more familiar with and take advantage of the greater specificity and disease relationship codes available in the ICD-10-CM code set, may see improvements in their cost profiles. If/when CMS creates a better risk adjustment model for Cost, patient Acuity documented in the past (e.g. the prior year) will be equivalent to money in the bank.
About the Author: Rod Baird is founder and president of Geriatric Practice Management (GPM) and gEHRiMed. Since 1977, he’s led provider and management organizations that deliver care to Medicare/Medicaid beneficiaries. He also was chosen to be a part of the Centers for Medicare and Medicaid Services’ (CMS) Innovation Advisors Program. Originally posted on LTC Management with permission to syndicate.