
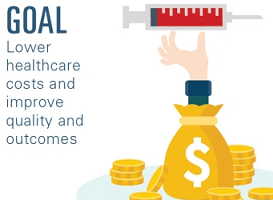
Using a picture and visual graphics to represent data and information is called an infographic. It is a great way to display statistical data that shows comparisons or charts that come from research and reports. In these infographics, see a revealing look at RCM, 8 ways to raise your margins, the top revenue cycle KPI’s, and the global health care sector outlook for 2016. See other infographics we have featured.
 Behind the Billing Office Door – A Revealing Look at RCM
When it comes to improving your practice’s financial performance, the first step is assessing whether your current RCM methods and metrics keep up—or fall short. Find out how your numbers compare to your peers’ in an insightful new RCM infographic by NextGen Healthcare (@NextGen), and see the following:
- How most practices quantify their Average Days in A/R
- How many payments and adjustments the average billing staffer posts daily
- How practices rate their ability to resolve denials and ensure services are billed
- How Net Collection Percentages, outstanding collection percentages, and first pass clean claim rates break down for practices
 8 Ways to Raise your Margins
Hospital finance executives are facing pricing pressures, transitions in patient coverage, and the emergence of new competitors. With your world changing so rapidly, it’s hard to pinpoint the most critical strategic focus areas among all the noise.
This infographic from The Advisory Board Company (@TheAdvisoryBd) takes a look at all the forces at play and distilled eight mandates you must address. Make sure your to-do list contains these must-dos—and read the infographic to explore each mandate’s details, impact, and difficulty.
 The Top Revenue Cycle Key Performace Indicators
Expeditive conducted a survey to see how many AR days hospitals have and how many they wished they had, and then we added the results to this infographic. Looking at KPIs is the best way to keep track of your healthcare revenue cycle. Where are your numbers and what should they actually be? Check out the complete infographic for the answers.
Expeditive (@Expeditive) is a provider of staffing and accounts receivable management services to healthcare providers.
 Deloitte’s 2016 Global Health Care Sector Outlook
This yearly look at the topics, trends, issues, and challenges impacting the global health care sector. Percent of GDP spent on health care globally is expected to decrease 10.1% by 2019. See the complete infographic from Deloitte here.
Deloitte (@DeloitteUS)- Life Sciences & Health Care – Their professionals guide traditional health care and life science companies and new market entrants in navigating the complexities of the US and global health care system. As market, political and legislative changes alter the industry, they help their clients develop innovative and practical solutions.