 By Sarianne Gruber
Twitter: @subtleimpact
Let’s start with a phenomenon known to statisticians called Simpson’s Paradox. In outcomes research, we are aggregating data from multiple sources (e.g., clinical, financial, workflow) and at the same time stratifying the data to achieve homogeneity. And there are times we get surprises. I created an example to illustrate the why’s and how’s. We are comparing survival data for surgical patients from two hospitals, Good Health and Mission Friendly. The patients have undergone coronary bypass surgery, and survival is defined as the patient lived at least 6 weeks post-surgery.
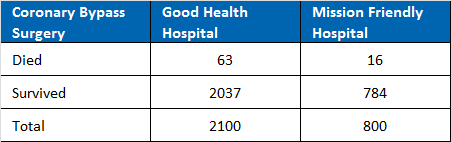
The contingency table (Table 1.) contains the results. Good Health Hospital has 63 deaths out of 2100 surgeries and Mission Friendly has 16 out of 800, a 3% mortality rate versus a 2% rate. When selecting a hospital, one would want that one percent in their favor for open heart surgery.
Table 1. Survival Outcomes Post Surgery by Hospital
Research is an art and a science. And to do good research you need to make sure you cover the four types of validity: Statistical, Internal, Construct and External. Statistical validity is when we validate the strength of the relationship among variables using statistical tools. Internal validity is the inherentness exists between (and among) variables. Construct validity is the extent that everything was well measured. And external validity is the extent to which the study results can be generalized to and across populations of persons, settings, times, outcomes and treatment variations.
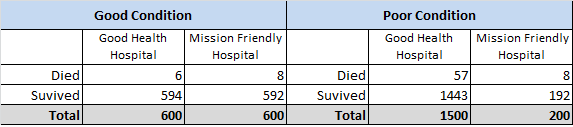
Using the four pillars of validity, good research must consider all inherent variables that could contribute to both poor and good outcomes. What other factors would contribute to successful outcomes? The “lurking variable” could be uncovered from past research findings, benefits of new medical techniques, patient care, hospital quality and the patient’s health. So in our example, I selected patient health. Patients can be classified as either in “poor” or “good” condition. Check that the entries in the two-way tables are just the sums of the “poor” and “good” entries for the new table (Table 2). Stratifying the patient sample by “poor” and “good” health, the outcomes results for Good Health Hospital is in its favor.
Good Health Hospital beats Mission Friendly Hospital for death rate for patients in good condition. Only 1% (6/600) dies in Good Health Hospital compared with 1.3% (8/600) in Mission Friendly Hospital. And Good Health wins again for patients in poor condition with 3.8% death rate (75/1500) compared to Mission Friendly Hospital’s 4% death rate (8/200). So Good Health Hospital is safer for both patients in good condition and patients in poor condition. If you are facing surgery, you would certainly choose Good Health Hospital.
Without digging deeper into our data and vetting out all possible scenarios to understand what is at the root cause or causes of a situation, we can miss an important finding. Check your pillars of valid research. Statistical methodology, good data, intrinsic sense and study comprehensiveness are all essential. Looking at my sample number, we see Good Health Hospital actually beats Mission Friendly Hospital in having better outcomes when we know a priori what condition the patient is in, for both good and poor health patients.
So what is Simpson’s paradox? It is when the confounding variable is introduced, which is patient heath condition, and the result, which is death rate, is reversed for the hospital. Good Health hospital has a large percentage of patients with poor health conditions, which is correlated to an increase of dying. The overall death rate for Good Health Hospital is 3%. This is why Simpson’s Paradox occurs.
Table 2. The Aha finding: Not all surgical patients are equal